Americans Spend About $100 Billion a Year on Lottery Tickets
Americans spend about $100 billion a year on lottery tickets. See who buys them, where the money goes, and what $20 a week on tickets costs over time.
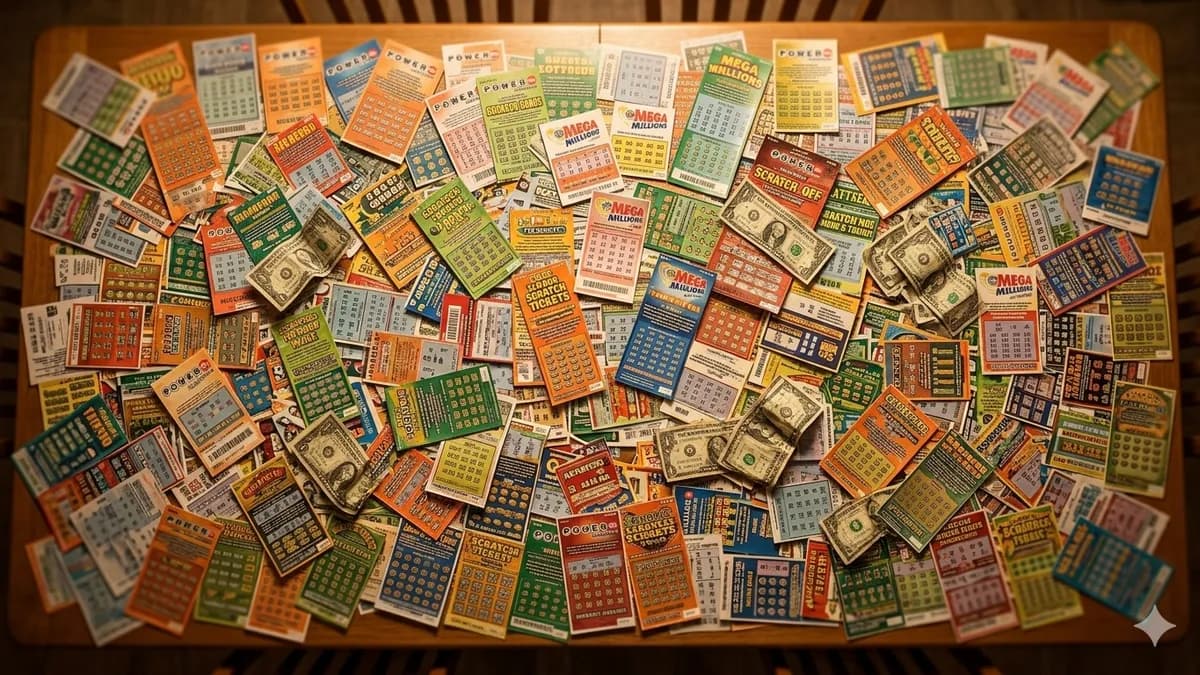
Americans spent $96.2 billion on traditional lottery tickets in fiscal year 2025, according to the North American Association of State and Provincial Lotteries, after topping $100 billion in each of the two years before. That is more than they spent on video games, recorded music, and movie tickets combined. On average about 67 cents of every dollar comes back as prizes, and the rest pays retailers, running costs, and the state's cut.
The number is so big it almost does not register: $96.2 billion.
That is how much Americans spent on traditional lottery tickets (scratch-offs, Powerball, Mega Millions, daily numbers games) in fiscal year 2025, according to the North American Association of State and Provincial Lotteries (NASPL). And that was a down year. The year before, ticket sales were $101.4 billion. Count the casino-style games and sports betting that many state lotteries also run, and fiscal 2025 sales reach $109.4 billion. Not million. Billion, with a B.
To put that in perspective, Americans spent more on lottery tickets than they spent on video games, recorded music, and movie tickets combined. This is one of the biggest legal gambling markets in the country, and most people have no idea how massive it really is.
Americans spent $96.2 billion on lottery tickets in fiscal 2025 (NASPL). Lower-income households spend a higher share of their income on tickets than anyone else. The lottery is not a game. It is a wealth extraction system that drains billions from the people who can least afford it, and state governments depend on it.
How Much Does the Average Person Spend?
Spread across every adult in the country, ticket sales work out to roughly $390 per adult a year. The Census Bureau counted $104.7 billion in state lottery ticket sales in fiscal 2024 (Annual Survey of State Government Finances), against about 266 million adults in its 2024 population estimates. (Census and NASPL count slightly differently, which is why their totals do not match exactly.) But averages are misleading. Plenty of people never buy a single ticket. The real spending is concentrated among regular players.
Among regular players the number runs far higher, as the income data below shows. That is real money spent on pieces of paper with a near-zero chance of paying off.
And some states take it much further. In Massachusetts, ticket sales came to about $860 per resident in fiscal 2024, the most of the ten biggest lottery states, based on the U.S. Census Bureau's Annual Survey of State Government Finances and Census population estimates. California sold the most tickets in total, $9.28 billion, with New York, Florida, and Texas close behind.
Here is how the highest per-resident states among the ten biggest sellers compare:
| State | Ticket Sales per Resident, FY2024 | Total Ticket Sales, FY2024 |
|---|---|---|
| Massachusetts | ~$859 | $6.13 billion |
| Virginia | ~$602 | $5.30 billion |
| North Carolina | ~$487 | $5.38 billion |
| Georgia | ~$479 | $5.36 billion |
| New York | ~$450 | $8.95 billion |
Sources: U.S. Census Bureau, Annual Survey of State Government Finances (ticket sales); Census Vintage 2024 population estimates. Per-resident figures are sales divided by population.
Those are not small numbers. In Massachusetts, that is about $72 a month for every man, woman, and child in the state.
Who Spends the Most on Lottery Tickets?
Here is where the story turns from surprising to painful. The people spending the most on lottery tickets are the people who can afford it the least.
A nationwide investigation by the Howard Center for Investigative Journalism at the University of Maryland found that stores selling lottery tickets are disproportionately clustered in lower-income communities in every state. The less you earn, the closer the counter is to your paycheck.
In a 2018 Bankrate survey reported by CBS News, people earning under $30,000 a year who played at least once a week spent $412 a year on tickets. Households earning $75,000 or more spent $105, about a quarter as much.
Think about that. People making under $30,000 a year are spending roughly four times as much on lottery tickets as households making more than twice their income.
$412/year
Lottery spending by weekly players earning under $30,000
Bankrate survey via CBS News, 2018
This is not random. Lottery retailers are disproportionately concentrated in lower-income neighborhoods. The advertising targets aspiration and desperation in equal measure. The system was built to extract money from the people with the fewest options. And it works because nobody taught them how to see through it.
The term "regressive tax" gets thrown around in policy debates, but the lottery is the most regressive revenue mechanism in American life. It takes from the bottom and funds the state.
Most people assume a tax is something the government takes. The lottery flips that. It is a tax you volunteer to pay, dressed up as entertainment, marketed the hardest to the people who can least afford it. No politician has to vote for it. No one has to explain it in a campaign ad. It just sits there, in every convenience store in the country, quietly pulling $412 a year out of the players with the least margin.

Where Does All That Money Go?
Not into your pocket. That much is certain.
State lotteries sold $104.7 billion in tickets in fiscal 2024, and here is where that money went, according to the U.S. Census Bureau:
- $70.2 billion (67%) went back to players as prizes
- $34.5 billion (33%) stayed with the lotteries, which pay retailer commissions and running costs out of it before the state takes its share
In fiscal 2025, lotteries sent $28.4 billion to state programs and other beneficiaries, according to NASPL.
The state's cut funds everything from education to infrastructure. Politicians love this arrangement because it generates revenue without the political pain of raising taxes. Nobody has to vote for a tax increase. People just hand over their money willingly.
But here is the catch: the effective "tax rate" on a lottery ticket is brutal. Across the country, about 67 cents of every dollar comes back in prize money. The rest goes to the state, to retailers, and to the cost of running the games. And that is the average across every game. On the giant jackpot draws, once the lump-sum haircut and taxes come out, the real return per ticket is far lower.
Compare that to a slot machine. Nevada's slot machines kept 7.13% of every dollar played over the twelve months through October 2025, according to the Nevada Gaming Control Board, which means they paid back about 93 cents. The lottery has a worse payout rate than the casino. And it is not even close.
Two out of every three dollars do come back as prizes. The catch is that they come back to a tiny number of winners, while the typical player's tickets pay nothing. And the state takes its cut before you ever scratch the ticket.
How Does Lottery Spending Compare to Other Categories?
This comparison makes the $96 billion hit differently.
Here is what Americans spent on other entertainment categories in the latest full year of data:
| Category | Annual U.S. Spending |
|---|---|
| Lottery tickets (fiscal 2025) | $96.2 billion (NASPL) |
| Video games, hardware, software and subscriptions (2024) | $59.3 billion (ESA and Circana) |
| Books and course materials, publisher revenue (2024) | $32.5 billion (AAP) |
| Recorded music, streaming and physical (2024) | $17.7 billion (RIAA) |
| Movie tickets, U.S. and Canada box office (2024) | $8.6 billion (Box Office Mojo) |
Americans spend more on lottery tickets than on video games, recorded music, and movie tickets combined. It is nearly three times what publishers take in from books.
We talk endlessly about "screen time" and entertainment spending as cultural problems. Nobody talks about the fact that the lottery quietly consumes more money than nearly every entertainment category in the country.
What Are the Actual Odds of Winning?
Here is the number the lottery industry would prefer you never sit with: the odds of winning the Mega Millions jackpot are 1 in 290,472,336 under the rules that took effect in April 2025 (Mega Millions). Powerball is no better at 1 in 292,201,338 (Powerball). These are not round numbers pulled from thin air. They are calculated directly from the combinatorics of each game.
Big numbers like that are hard to feel, so make them real. Your odds of being struck by lightning in a given year are 1 in 1,222,000, per the National Weather Service. That is about 240 times likelier than hitting either jackpot with a single ticket. Getting struck by lightning is the textbook example of something you would call basically impossible, and it still beats the thing the billboard is selling by hundreds of times.
If you bought one ticket per week, every week, without missing, it would take you roughly 3.9 million years to reach a coin-flip chance of winning. Not a guarantee. Just a 50/50 shot. The dinosaurs went extinct 66 million years ago. You would need to play for about a seventeenth of that timespan.
Things More Likely Than Winning the Lottery
Odds with one ticket. Log scale: each gridline is 10 times less likely than the last
Sources: National Weather Service (lightning, 2009 to 2018 averages); Powerball and Mega Millions official game odds (Mega Millions since its April 2025 redesign). Card and coin odds are exact math.
The human brain does not handle a number like 1 in 290 million well. It mostly just registers "a chance" and stops doing the math. That is exactly what lottery marketing is engineered to exploit. A billboard advertising a $1.5 billion payout is not trying to help you calculate expected value. It is trying to make you stop calculating entirely. The chart above shows the gap visually, and it uses a log scale, so every step along the axis is ten times rarer than the last. The jackpot bars are not just longer than the others. They sit orders of magnitude further out.
The comparisons sound almost cute until you stack them on a real scale. A lightning strike is the stuff of freak-accident headlines, and it still beats your jackpot odds by about 240 to 1. None of that ever makes it onto the ticket.
The Smaller Prizes Are Not Saving You Either
The industry knows the jackpot odds sound bad, which is why they lean so hard on the smaller prize tiers: "even if you don't win the big one, there are nine ways to win." It sounds reassuring. It is also the part of the pitch designed to keep you buying after the jackpot dream wears off. The smaller prizes are not a consolation. They are the hook that keeps the habit alive between drawings.
Here is what those "nine ways to win" actually pay on a $5 Mega Millions ticket at the smallest built-in multiplier, 2x, which comes up on almost half of tickets.
| Prize | Odds | Payout |
|---|---|---|
| Jackpot (5 + Mega Ball) | 1 in 290,472,336 | Hundreds of millions |
| 5 numbers | 1 in 12,629,232 | $2,000,000 |
| 4 + Mega Ball | 1 in 893,761 | $20,000 |
| 4 numbers | 1 in 38,859 | $1,000 |
| 3 + Mega Ball | 1 in 13,965 | $400 |
| 3 numbers | 1 in 607 | $20 |
| 2 + Mega Ball | 1 in 665 | $20 |
| 1 + Mega Ball | 1 in 86 | $14 |
| Mega Ball only | 1 in 35 | $10 |
Source: Mega Millions. Multipliers of 3x to 10x raise every prize except the jackpot.
The overall odds of winning any prize are about 1 in 23. That sounds decent until you realize most of those wins are the bottom tiers, $10 to $14 at the usual multiplier on a $5 ticket. Run every prize except the jackpot through the odds and the average multiplier, and they hand back about 22 cents of every dollar, roughly $1.12 per $5 ticket, according to Wizard of Odds. The jackpot adds about 7 cents per dollar for every $100 million of advertised prize, but that is before the lump-sum cut, taxes, and the chance of splitting it. Wizard of Odds puts the break-even jackpot, after the lump sum and the top federal tax rate, at about $3.6 billion, and once split jackpots are counted the game never turns positive. You lose money on average, every single ticket.
The Lottery Is Not a Game. It Is a System.
State lotteries spend more than half a billion dollars a year on advertising, according to a 2022 investigation by the Howard Center for Investigative Journalism. That money goes toward one goal: making you forget the math.
The commercials never show the odds table. They show the boat, the beach house, the moment you quit your job. They sell a fantasy because the reality, a guaranteed long-term loss, does not make for a good ad.
And the advertising works. A 2016 Gallup poll found that 49% of American adults had bought a state lottery ticket in the past year. Half the country is playing a game where the house keeps about 33 cents of every dollar.
Meanwhile, state lottery commissions aggressively promote new games, scratch-off variants, and multi-state jackpots to keep revenue growing. The product pipeline looks less like a public service and more like a consumer goods company optimizing for maximum extraction.
The games themselves are engineered around the same psychology that makes slot machines addictive. Matching 3 out of 5 numbers feels like you were close, even though the odds of a near-miss and the odds of the jackpot exist in completely different universes. Researchers at the University of Cambridge found that near-misses activate the same reward pathways in the brain as actual wins. Scratch-offs go further, using variable-ratio reinforcement: small, unpredictable wins at random intervals, one of the most habit-forming reward patterns behavioral psychologists have documented. B.F. Skinner mapped it in the 1950s. Lottery game designers use it today.
When the Powerball or Mega Millions jackpot crosses $500 million, media coverage creates a buying frenzy. This is manufactured FOMO. The odds do not change. They are still roughly 1 in 292 million for Powerball and 1 in 290 million for Mega Millions. The headline changed. The math did not.
Tired of feeding the machine?
Learn where your money actually goes and what to do about it.
What Else Could That Money Do?
Here is the question the system does not want you to ask.
You do not need to "find" extra money to start building wealth. If you buy lottery tickets, you are already making a weekly investment. You are just investing in a system designed to take your money and give almost nothing back. So what happens if you take that exact same amount, the money you have already decided you can live without, and point it somewhere that works in your favor?
Let's keep it conservative and run two amounts: $20 per week ($1,040 a year) and $50 per week ($2,600 a year). Those are normal numbers for a regular player. The only question is where the money goes next.

Every figure in this section uses one model: a deposit every week, each growing at the stated annual rate (converted to its weekly equivalent), nothing withdrawn.
The safest, most boring option is a high-yield savings account. The best advertised rate on Bankrate's list was 4.27% APY on October 10, 2026. No market risk, FDIC insured, your money just sits there and grows. Assume that rate held for the whole stretch (it will not, savings rates move with the Fed) and $20 a week becomes about $12,900 after 10 years and $32,500 after 20. At $50 a week, you cross $81,000 in 20 years. Nothing flashy. Just your money growing quietly while you sleep, instead of a guaranteed loss at the counter.
Step up to an S&P 500 index fund, which has returned about 10% a year on average since 1928 (NYU Stern, 10.02% a year through 2025). You do not pick stocks. You do not watch CNBC. You buy an index fund and keep adding to it. That is dollar cost averaging, and it works. At $20 a week, that grows to about $17,400 in 10 years and $62,400 in 20. At $50 a week, $52,000 in total contributions becomes about $156,000. Same money. Same weekly habit. Different destination. And you never had to get lucky.
How the Alternatives Stack Up Against the Lottery
Here is every option side by side. Twenty dollars a week for 10 years. Same money, different choices.
| Where Your $20/Week Goes | 10-Year Total In | 10-Year Value | Net Gain/Loss |
|---|---|---|---|
| Lottery tickets | $10,400 | ~$7,000* | -$3,400 |
| High-yield savings (4.27%) | $10,400 | $12,900 | +$2,500 |
| S&P 500 index fund (10%) | $10,400 | $17,400 | +$7,000 |
| Bitcoin, actual Oct 2016 to Sep 2026** | $10,392 | $114,200 | +$103,800 |
*Lottery return calculated at 67 cents per dollar spent, the national average prize payout in fiscal 2024 (U.S. Census Bureau). **A real backtest, not a projection: $86.60 a month (the site calculator's conversion of $20 a week) bought at each month-end close, Coin Metrics prices.
Every single alternative beats the lottery. Even the most conservative option imaginable, a plain savings account, still puts you nearly $6,000 ahead of the tickets across a decade. The index fund puts you over $10,000 ahead. Bitcoin's actual last ten years turned $10,392 into about $114,200, but that window starts before two of its biggest run-ups and says nothing about the next ten. Bitcoin is volatile enough to drop 50% or more in a single stretch, and it is about 34% below its October 2025 high right now. Past performance never guarantees future results, so treat that line as history, not a promise.
That negative number is the part the billboards never show. A decade of $20 weekly tickets is not "breaking even while you wait for the big one." It is actively losing about $3,400 of your own money. If any private company sold a product with a guaranteed negative expected return and advertised it on highway billboards, regulators would shut it down within a week. Because the state runs the lottery, the same math gets called entertainment. Same outcome, different branding.
Zoom out and the gap only widens. Run the same $20 a week for 30 years in an index fund and you reach about $179,000. Run it for 50 years, an adult lifetime, and the S&P 500 line passes $1.2 million. Over that same half-century, $20 a week on lottery tickets returns expected total winnings of about $34,800 against $52,000 spent, at the national 67-cent payout. You lose a third of everything you put in, while the saver beside you quietly builds a retirement. Time does not punish the saver. It punishes the person still standing at the counter.
The Difference Is One Line Climbing and One Draining
The cleanest way to see it is to put the boring option, a plain index fund, next to the lottery on a single chart. Not Bitcoin. Not day trading. Just $20 a week and time.
$20 a Week for 10 Years: Index Fund vs. Lottery
Net gain or loss on the same $10,400, year by year. One line climbs to +$6,975. The other drains to -$3,432.
Model: $20 a week for 520 weeks. Index fund at 10% a year, the S&P 500's long-run average since 1928 (NYU Stern). Lottery at about 67 cents back per dollar played (U.S. Census Bureau, FY2024). Past returns do not guarantee future ones.
The chart above is the real punchline. One line climbs. The other drains. Same dollar in both cases. The only variable is where you let it land. Once you see the gap, the idea of a $2 ticket stops feeling harmless and starts looking like a slow, recurring withdrawal from your future self. The lottery is not an investment. It is a leak, sold to generations of working people as a harmless shot at a better life.
How to Actually Make the Switch
Knowing the math is step one. Acting on it is everything. Here is how to redirect your lottery money starting this week.
1. Pick your amount. Whatever you currently spend on tickets, that is your number. If you are not sure, start with $20 a week. You will not miss it. You were already spending it.
2. Automate it. Remove willpower from the equation. Set up a recurring weekly transfer or buy so the money moves without you thinking about it. Automation is what makes dollar cost averaging stick.
3. Choose where it goes. You do not have to pick just one. A high-yield savings account at an online bank for the safe portion, starting with an emergency fund. A total-market index fund in a brokerage account for long-term growth. A recurring weekly Bitcoin purchase if you want exposure to a fixed-supply asset and can stomach the swings.
4. Stop buying tickets. This is the hard part, not because you need the money, but because the habit is comfortable. Replace the ritual. Every time you would have bought a ticket, check your investment balance instead. Watch it grow. That is your new dopamine hit.
You do not need a windfall. You do not need to get lucky. The money is real, the habit is already formed, and the only thing missing is a better destination for it.
Run the numbers on your own lottery spending. Multiply what you spend per week by 52. That is your annual cost. Now imagine that amount growing at 10% per year for a decade. The gap between those two numbers is what the lottery is really costing you.
And lottery tickets are just one leak. Daily coffee, impulse purchases, forgotten subscriptions: they all add up. See: The latte factor is real (but it is bigger than coffee)
Frequently Asked Questions
U.S. lottery ticket sales were $96.2 billion in fiscal 2025, after $101.4 billion the year before (NASPL). Spread across every adult, the Census Bureau's fiscal 2024 total of $104.7 billion works out to roughly $390 a year. But that average is misleading because many people never buy a ticket, and regular players spend far more. In Massachusetts, ticket sales came to about $860 per resident.
Lottery retailers are disproportionately clustered in lower-income neighborhoods (Howard Center), and the advertising targets aspiration and desperation in equal measure. In a 2018 Bankrate survey, weekly players earning under $30,000 spent $412 a year on tickets, about four times what households earning $75,000 or more spent. The system was built to extract money from the people with the fewest options, and nobody taught them to see through it.
About 67% goes back as prizes (but spread across millions of tickets, so most players lose), according to the Census Bureau's fiscal 2024 figures. The other 33% covers retailer commissions, operating costs, and the state's share, which came to $28.4 billion for state programs in fiscal 2025 (NASPL). For every dollar you spend, you can expect to get back about 67 cents on average, and less on the big jackpot games. That is a worse payout rate than a Nevada slot machine, which pays back about 93 cents.
If you redirected just $20 per week into an S&P 500 index fund averaging 10% annual returns, you would have approximately $17,400 after 10 years and $62,400 after 20 years. That same $10,400 spent on lottery tickets over a decade would return roughly $7,000 in prizes. The gap is over $10,000 for doing nothing differently except changing where the money goes. A high-yield savings account or a recurring Bitcoin purchase beats the lottery too. Every realistic alternative does.
Yes. Nevada's slot machines paid back about 93 cents of every dollar played in the year through October 2025 (Nevada Gaming Control Board). The lottery returns about 67 cents on average. On top of that, state lotteries spend more than half a billion dollars a year on advertising designed to make you forget those odds. The actual odds of winning Powerball are roughly 1 in 292 million, and Mega Millions is 1 in 290 million.
The lottery uses the same psychological tricks as slot machines. Near-misses, like matching 3 out of 5 numbers, activate reward pathways in your brain that make losing feel like almost-winning. Jackpot rollovers create manufactured urgency every time the headline number climbs. And scratch-offs use variable-ratio reinforcement, one of the most habit-forming reward patterns ever documented. The games are engineered to keep you playing, not to help you win.
Replace the ritual. Every time you would have bought a ticket, check your investment balance instead. Set up an automatic weekly transfer or recurring Bitcoin purchase using dollar cost averaging so the money moves without requiring willpower. The habit of spending is already formed. You are just pointing it somewhere that works in your favor instead of against you.
This article is part of the You're Already Wasting Money series on Untaught. The system was built to keep you spending without thinking. These articles exist to help you see where the money actually goes.
This article is for educational purposes only and does not constitute financial advice. Untaught does not hold, move, or custody any funds. Past performance does not guarantee future results. Always do your own research before making investment decisions.
Quick calculator
Your coffee money could have become
$19,233
from $9,900 invested
Monthly buys, Oct 2021 to Sep 2026, at Coin Metrics month-end closes. Past results, not a forecast.