How the Government Prints Money (and Why You Pay for It)
The U.S. money supply grew by 40% in just two years. Here's how government money printing works in plain English, and why every new dollar makes yours worth less.
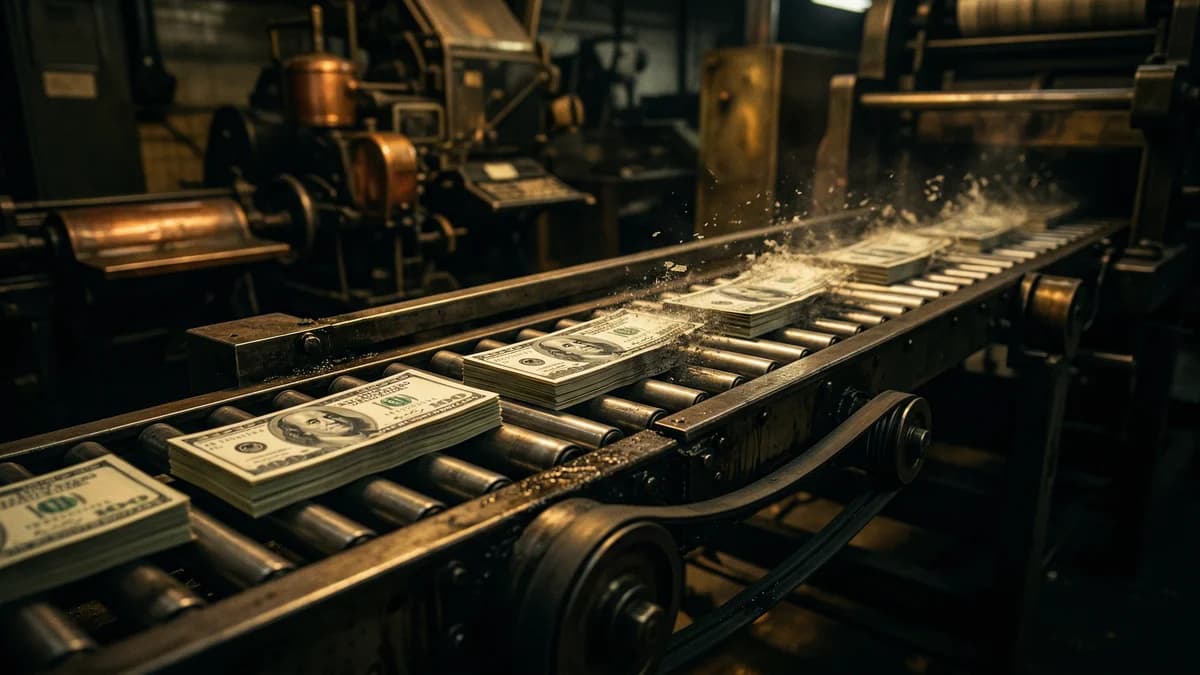
The U.S. government "prints money" primarily through the Federal Reserve, which creates new dollars digitally by purchasing bonds. The U.S. money supply grew by roughly 40% between February 2020 and March 2022, adding about $6.3 trillion in new dollars. More dollars chasing the same goods drives prices up, reducing the value of every dollar already in circulation, including yours.
Between February 2020 and March 2022, the Federal Reserve and the banking system created about $6.3 trillion in new money. That's trillion, with a T. According to Federal Reserve M2 data, the total money supply jumped from $15.49 trillion to $21.79 trillion in just over two years.
Nobody asked your permission. Nobody sent you a warning. But you felt it. At the grocery store. At the gas pump. In your rent check.
Every new dollar they created made the dollars you already had worth a little less. That's not a theory. That's math.
The U.S. money supply grew by roughly 40% between 2020 and 2022, according to Federal Reserve M2 data. The government doesn't literally print most of this money. The Federal Reserve creates it digitally by buying bonds. More dollars in the system means each one buys less. That's why your groceries, rent, and gas cost more. You're paying for it whether you understand it or not.
Read more: What Is Purchasing Power? | What Is Fiat Currency? | Is the Dollar Losing Value? 50+ Years of Data
What Does "Printing Money" Actually Mean?
Here's the thing: the government doesn't literally fire up a printing press every time it needs more cash. Some physical bills get printed, sure. The Federal Reserve's 2027 print order calls for 4.8 billion to 5.7 billion new notes, worth $132.1 billion to $166.4 billion. But that's mostly replacing old, worn-out bills.
The real action happens digitally.
When people say "the government prints money," they're talking about a process controlled by the Federal Reserve. The Fed is America's central bank. Think of it as the institution that controls how many dollars exist and how expensive it is to borrow them.
The Fed's main tool is something called "quantitative easing." That's a fancy term for a simple idea: the Fed creates brand-new digital dollars and uses them to buy bonds from banks and the government. Those purchases pump fresh money into the financial system.
No physical paper changes hands. No ink. No press. Just numbers on a screen. But those numbers are real, and they have real consequences for every dollar you own.
Put the paper and the screen side by side and the gap is obvious. Physical cash is about one dollar in ten.
| What gets counted | Amount | As of |
|---|---|---|
| New paper notes the Fed has ordered for 2027 | $132.1B to $166.4B | 2027 print order |
| All currency held by the public | $2.39 trillion | August 2026 |
| Fed balance sheet (what QE built) | $6.74 trillion | September 30, 2026 |
| Total M2 money supply | $23.34 trillion | August 2026 |
Sources: Federal Reserve Board print order; FRED series CURRSL, WALCL and M2SL.
Read more: Why Your Savings Account Is Quietly Losing Money
How Does New Money Get Into the Economy?
The process works in steps. None of them are complicated once you strip out the jargon.
Step 1: The government needs money. Congress approves spending, whether that's stimulus checks, infrastructure, or military budgets. When spending exceeds tax revenue (which it almost always does), the government borrows by selling Treasury bonds.
Step 2: The Federal Reserve steps in. The Fed buys those Treasury bonds. Where does the Fed get the money? It creates it. Out of nothing. This is the part that sounds like it can't be real, but it is. The Fed has the legal authority to create U.S. dollars by adding numbers to its own balance sheet.
Step 3: Banks get flooded with new cash. When the Fed buys bonds from banks and financial institutions, those banks suddenly have more money to lend. They lend it to businesses and consumers, and that money circulates through the economy.
Step 4: Prices rise. More dollars chasing the same amount of stuff. Same number of houses. Same amount of food. Same gallons of gas. But more money bidding on all of it. Prices go up. Your dollar buys less.
That's it. That's the whole machine.
The Federal Reserve's balance sheet ballooned from $4.2 trillion in early 2020 to nearly $9 trillion by early 2022, per the Fed's own weekly balance sheet data, peaking at $8.97 trillion in April 2022. That means the Fed more than doubled its holdings in under two years. Most of that expansion came from buying U.S. Treasury bonds and mortgage-backed securities.
Why Can't You or I Just Create Money?
This is a fair question. If the Federal Reserve can create money out of thin air, why can't the rest of us?
Because the law says so. Only the Federal Reserve has this power. It was granted by the Federal Reserve Act of 1913. No other institution, no individual, no state government, and no private bank can create U.S. dollars from nothing.
If you tried it, that would be counterfeiting. Federal crime. Up to 20 years in prison.
But when the Fed does it? It's called "monetary policy."
The difference isn't economic. It's legal. The effect on your purchasing power is the same whether a counterfeiter floods the market with fake bills or the Federal Reserve floods it with real ones. More dollars, each worth less.
People tend to think of counterfeiting as the bad-guy version of money printing. But economically, there's no functional difference. Both increase the supply of dollars. Both reduce the value of every dollar already in circulation. The only distinction is who's allowed to do it.
What Happened During COVID? The Numbers Are Staggering
The COVID-19 pandemic triggered the largest money-creation event in modern American history. And the numbers are hard to overstate.
According to the Federal Reserve's M2 data, the U.S. money supply increased by about $6.3 trillion between February 2020, the last month before the pandemic hit, and March 2022, when it peaked at $21.79 trillion before shrinking for the next year and a half. That's a 40.6% increase in 25 months.
To put that in perspective: it took from 1913 (when the Fed was created) to about 2000 to build the first $4.9 trillion in M2 money supply. Then it took just over two years during COVID to add more than that entire amount.
Eighty-seven years versus two years. Let that sink in.
U.S. Money Supply (M2): 60 Years of Growth, Then an Explosion
Total dollars in circulation, in trillions. December of each year, through August 2026.
Source: Federal Reserve, M2 Money Stock (FRED series M2SL), December readings through August 2026
Congress passed several massive relief packages, starting with the CARES Act in March 2020. Then came additional rounds of stimulus checks, expanded unemployment benefits, Paycheck Protection Program loans, and more. Legislative relief allowed $6.2 trillion in total, according to the Committee for a Responsible Federal Budget's COVID Money Tracker.
The Federal Reserve backed all of it by buying bonds at an unprecedented pace. At the peak, the Fed was purchasing $120 billion in bonds per month: at least $80 billion in Treasuries and $40 billion in mortgage-backed securities.
The result? Prices climbed. The Consumer Price Index hit 9.1% annual inflation in June 2022, per the Bureau of Labor Statistics. That was the highest rate since November 1981.
Read more: What $100 Used to Buy (and What It Gets You Today)
How Does Money Printing Hit Your Wallet?
Here's where the abstract becomes painfully concrete.
Think about it like juice. You have a pitcher of orange juice. It tastes great. Now someone pours a bunch of water into the pitcher. Same container. More liquid. But every sip is weaker. Less flavor. Less value.
That's what money printing does to your dollars. The government adds trillions of new dollars to the system. Your paycheck stays roughly the same. But every dollar in that paycheck is diluted.
You feel it everywhere:
- Groceries. Food at home costs 31.7% more than it did in February 2020, per the BLS Consumer Price Index. A dozen eggs went from $1.45 to $4.82 by January 2023, then to a record $6.23 in March 2025.
- Rent. The CPI for rent of a primary residence is up 32.6% since February 2020, and unlike eggs it has never come back down. It set a new high in August 2026.
- Gas. A gallon of regular averaged $1.88 in April 2020 and $5.06 in June 2022, per BLS average price data. It was still $4.20 in August 2026.
- Cars. Used car and truck prices peaked 55.5% above their February 2020 level in July 2022, per the CPI, and are still 34.3% higher.
None of these price increases happened in a vacuum. When you flood the economy with trillions of new dollars, this is what you get.
Here is the same story in one place, measured from February 2020, the last month before the money started pouring in. Index rows are set to 100 in February 2020 so a reader can compare them directly with the dollar prices.
| Item | Feb 2020 | Aug 2026 | Change | Worst point |
|---|---|---|---|---|
| Eggs, dozen | $1.45 | $2.27 | +57% | +330% (Mar 2025) |
| Regular gas, gallon | $2.47 | $4.20 | +70% | +105% (Jun 2022) |
| Used cars and trucks | 100 | 134.3 | +34% | +55% (Jul 2022) |
| Rent | 100 | 132.6 | +33% | +33% (Aug 2026) |
| Food at home | 100 | 131.7 | +32% | +32% (Jul 2026) |
| Everything (CPI-U) | 100 | 129.5 | +29.5% | +29.6% (May 2026) |
Source: Bureau of Labor Statistics, CPI-U and average price series, not seasonally adjusted.
You probably remember the moment it hit you. Maybe it was standing in the checkout line, watching the total climb past what you expected. Maybe it was signing a lease renewal that was $200 more than last year. That feeling of "wait, everything just got more expensive" wasn't paranoia. It was math.
Who Benefits When New Money Gets Created?
Not you. Not most people, actually.
There's a concept in economics called the Cantillon Effect, named after an 18th-century economist. The idea is simple: when new money enters the system, the people closest to the source benefit the most.
Banks and large financial institutions get access to the new money first. They can invest it, lend it, and buy assets before prices adjust upward. By the time the new money trickles through the economy and reaches your paycheck or your bank account, prices have already risen.
The rich get richer. Not because they work harder. Because they're closer to the money printer.
The Federal Reserve's own Distributional Financial Accounts show how it played out. Between the end of 2019 and the end of 2021, the top 1% of households added $11.0 trillion in net worth, going from $32.7 trillion to $43.7 trillion. The entire bottom half of the country added $1.6 trillion. The top 1% took 32% of all the new wealth created in those two years. The bottom 50% took less than 5%.
$11.0T
Net worth added by the top 1% of households, end of 2019 to end of 2021
Federal Reserve, Distributional Financial Accounts
Measured per household, the gap is wider still. The bottom 50% is fifty times as many households as the top 1%, so each slice of 1% of households in the bottom half gained about $32 billion while the top slice gained $11 trillion. That is roughly 343 to 1.
Who Got the New Wealth: Gain per 1% of Households, 2020 and 2021
Net worth added from the end of 2019 to the end of 2021, divided by the size of each group
Source: Federal Reserve, Distributional Financial Accounts, 2019 Q4 and 2021 Q4 net worth by wealth percentile.
You didn't get a seat at the table when the money was being created. But you're absolutely paying the bill now that prices have adjusted. The $11 trillion number above is not an abstraction. It represents the direct transfer of purchasing power from wage earners to asset holders. Every percentage point of inflation is another dollar skimmed off your paycheck and deposited into a portfolio you don't own.
Read more: Nobody Taught You This
This is what Cantillon Effect looks like at the household level. You go to the grocery store and notice the shelf price has climbed again. You get a 3% raise at work and it barely covers the increase in your rent. You watch asset prices, home prices, stock prices, Bitcoin prices, move in ways that have nothing to do with your paycheck.
Fewer items on the shelf. Higher prices on what's left. Shrinking package sizes for the same sticker price. The dollars you earn buy less every year, and the gap between wage growth and asset growth keeps widening. That's not a coincidence. That's the design.
The technical term for this is "shrinkflation." Snack brands cut ounces. Toilet paper rolls get thinner. Coffee containers lose a couple of tablespoons. The sticker price holds steady while the product you actually take home gets smaller. It's inflation hiding in plain sight, and it works because most people don't weigh their cereal boxes.
Meanwhile the headline numbers on the evening news talk about inflation "cooling." Prices are still rising, just more slowly than last year. That's the definition of inflation cooling, not prices coming back down. Once a price goes up in this system, it almost never comes back. The dollar you earned five years ago is gone in every meaningful sense.
They print money. You pay the price.
Join thousands learning how the system really works and what you can do about it.
Is There Any Way to Protect Yourself?
The honest answer: you can't stop the government from creating money. You can't vote on Federal Reserve policy. You don't get a say in how much money exists.
But you can stop pretending your dollars are safe sitting in a savings account. The FDIC's national average savings rate was 0.37% as of September 21, 2026, while consumer prices rose 3.4% over the twelve months through August 2026, per the BLS. That's a guaranteed loss in real terms.
Understanding this problem is the first step. Most people never get even this far, because nobody taught them how money works. The system benefits from that ignorance.
The second step is looking at where your money goes every week and asking: is this helping me, or is it just evaporating? That's a different conversation, and it starts with seeing the problem clearly.
You're seeing it now.
Every new dollar the Federal Reserve creates makes the dollars in your wallet worth less. You cannot stop them from printing money. But you can stop leaving all of your savings in a system designed to erode their value.
Frequently Asked Questions
The questions below cover the pieces most people get stuck on when they first learn how dollar creation actually works. The mechanics are intentionally opaque, and the people who benefit from that opacity are not eager to clear it up.
Your dollars are losing value, and the machinery behind it isn't hidden. It's just never explained to you in plain terms. Now you've seen how it works: the Fed creates money, prices rise, and your purchasing power shrinks.
Want to see what that erosion looks like in real, everyday terms? Read What $100 Used to Buy (and What It Gets You Today) for a decade-by-decade breakdown that makes this impossible to ignore.
And if you're wondering why none of this was ever covered in school, that's not an accident either. Read Nobody Taught You This to understand who benefits from keeping you in the dark.
This article is part of the Your Money Is Losing Value series. The dollar has lost over 25% of its purchasing power in the last decade, and the money-printing machine is a big reason why. Start at the beginning to see the full picture.
This article is for educational purposes only and does not constitute financial advice. Untaught does not hold, move, or custody any funds. Past performance does not guarantee future results. Always do your own research before making investment decisions.
Quick calculator
Your coffee money could have become
$16,301
from $9,900 invested